Versi dalam bahasa Indonesia: Sinyal Beli & Jual
The Buy and Sell signals are based on technical analysis data. This document describes the generation rules to translate technical analysis data into Buy and Sell signals.
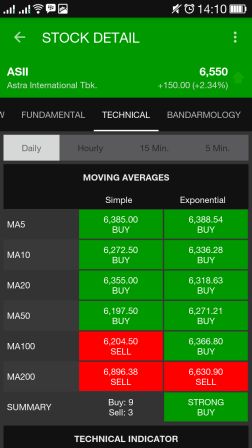
Moving Average (MA)
Moving averages can be used to identify the direction of the trend or define potential support and resistance levels.
The two most popular types of moving averages are the Simple Moving Average (SMA) and the Exponential Moving Average (EMA).
A simple moving average is formed by computing the average price of a security over a specific number of periods.
Exponential moving averages reduce the lag by applying more weight to recent prices.
The weighting applied to the most recent price depends on the number of periods in the moving average.
Moving Average signal generation rule:
A buy signal is generated when moving average chart curve upward (current moving average value is greater than previous moving average value).
A sell signal is generated when moving average chart curve downward (current moving average value is less than previous moving average value).
If current moving average value is equal to previous moving average, no signal is generated (Neutral).
Relative Strength Index (RSI)
The Relative Strength Index (RSI) indicator is a momentum oscillator that measures the speed and change of price movements.
RSI oscillates between zero and 100.
RSI signal generation rule:
Overbought > 70 > BUY > 52 > Neutral > 48 > SELL > 30 > Oversold
The overbought / oversold condition is not a buy / sell signal as momentum oscillators can become overbought / oversold and remain so in a strong up / down trend.
The overbought / oversold readings serve as an alert to be ready for a turning point. Prices are overbought / oversold, but have yet to actually turn.
Stochastic
The Stochastic Oscillator is a momentum indicator that shows the location of the close relative to the high-low range over a set number of periods.
Stochastic signal generation rule:
Overbought > 80 > BUY > 52 > Neutral > 48 > SELL > 20 > Oversold
The overbought / oversold condition is not a buy / sell signal as momentum oscillators can become overbought / oversold and remain so in a strong up / down trend.
The overbought / oversold readings serve as an alert to be ready for a turning point. Prices are overbought / oversold, but have yet to actually turn.
StochRSI
The StochRSI is an oscillator that measures the level of RSI relative to its high-low range over a set time period.
StochRSI applies the Stochastics formula to RSI values, instead of price values.
This makes it an indicator of an indicator. The result is an oscillator that fluctuates between 0 and 1.
StochRSI signal generation rule:
Overbought > 80 > BUY > 52 > Neutral > 48 > SELL > 20 > Oversold
The overbought / oversold condition is not a buy / sell signal as momentum oscillators can become overbought / oversold and remain so in a strong up / down trend.
The overbought / oversold readings serve as an alert to be ready for a turning point. Prices are overbought / oversold, but have yet to actually turn.
MACD
The MACD turns two trend-following indicators, moving averages, into a momentum oscillator by subtracting the longer moving average from the shorter moving average.
As a result, the MACD offers the best of both worlds: trend following and momentum.
The MACD fluctuates above and below the zero line as the moving averages converge, cross and diverge.
MACD signal generation rule:
BUY > 2 > Neutral > -2 > SELL
ATR
The Average True Range (ATR) is an indicator that measures volatility.
ATR will not generate a buy / sell signal, just volatility.
ATR signal generation rule:
Current ATR – SMA5(ATR) = DIFF : High Volatile > 2 > Neutral > -2 > Less Volatile
ADX
The Average Directional Index (ADX) measures trend strength without regard to trend direction.
The other two indicators, Plus Directional Indicator (+DI) and Minus Directional Indicator (-DI), complement ADX by defining trend direction.
The Average Directional Index (ADX) is used to measure the strength or weakness of a trend, not the actual direction.
Directional movement is defined by +DI and -DI.
In general, the bulls have the edge when +DI is greater than – DI, while the bears have the edge when – DI is greater.
Crosses of these directional indicators can be combined with ADX for a complete trading system.
ADX signal generation rule:
1: STRONG TREND > 25 > WEAK TREND
2: +DI – -DI = DIFF : BUY > 0 > SELL
CCI
CCI measures the current price level relative to an average price level over a given period of time.
High positive readings indicate that prices are well above their average, which is a show of strength.
Low negative readings indicate that prices are well below their average, which is a show of weakness.
CCI signal generation rule:
Overbought > 100 > BUY > 50 > Neutral > -50 > SELL > -100 > Oversold
The overbought / oversold condition is not a buy / sell signal as momentum oscillators can become overbought / oversold and remain so in a strong up / down trend.
The overbought / oversold readings serve as an alert to be ready for a turning point. Prices are overbought / oversold, but have yet to actually turn.
UO
The Ultimate Oscillator rises when Buying Pressure is strong and falls when Buying Pressure is weak.
UO signal generation rule:
Overbought > 70 > BUY > 52 > Neutral > 48 > SELL > 30 > Oversold
The overbought / oversold condition is not a buy / sell signal as momentum oscillators can become overbought / oversold and remain so in a strong up / down trend.
The overbought / oversold readings serve as an alert to be ready for a turning point. Prices are overbought / oversold, but have yet to actually turn.
ROC
The Rate-of-Change (ROC) indicator is a pure momentum oscillator that measures the percent change in price from one period to the next.
The ROC calculation compares the current price with the price “n” periods ago.
ROC signal generation rule:
Overbought > 10 > BUY > 0 > Neutral > 0 > SELL > -10 > Oversold
The overbought / oversold condition is not a buy / sell signal as momentum oscillators can become overbought / oversold and remain so in a strong up / down trend.
The overbought / oversold readings serve as an alert to be ready for a turning point. Prices are overbought / oversold, but have yet to actually turn.
WilliamsR
Williams %R is a momentum indicator that is the inverse of the Fast Stochastic Oscillator. Also referred to as %R, Williams %R reflects the level of the close relative to the highest high for the look-back period.
Williams %R oscillates from 0 to -100. Readings from 0 to -20 are considered overbought. Readings from -80 to -100 are considered oversold.
WilliamsR signal generation rule:
Overbought > -20 > BUY > -48 > Neutral > -52 > SELL > -80 > Oversold
The overbought / oversold condition is not a buy / sell signal as momentum oscillators can become overbought / oversold and remain so in a strong up / down trend.
The overbought / oversold readings serve as an alert to be ready for a turning point. Prices are overbought / oversold, but have yet to actually turn.
Disclaimers
All information contained herein should be independently verified and confirmed.
User agrees that the use of this software application and it’s information and services is entirely at his/her own risk.