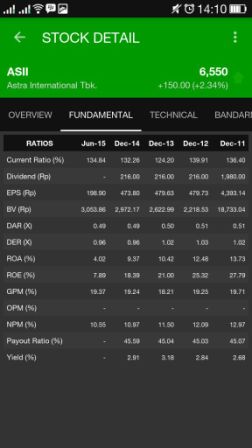
Current Ratio (%)
The current ratio is a liquidity ratio that measures a company’s ability to pay short-term and long-term obligations.
To gauge this ability, the current ratio considers the total assets of a company (both liquid and not liquid) relative to that company’s total liabilities.
The formula for calculating a company’s current ratio, then, is:
Current Ratio = Current Assets / Current Liabilities
The current ratio is called “current” because, unlike some other liquidity ratios, it incorporates all current assets and liabilities.
The current ratio is also known as the working capital ratio.
Dividend (Rp)
A dividend is a distribution of a portion of a company’s earnings, decided by the board of directors, approved by shareholders, to a class of its shareholders.
Dividends can be issued as cash payments, as shares of stock, or other property.
Start-ups and other high-growth companies such as those in the technology or biotechnology sectors rarely offer dividends because all of their profits are reinvested to help sustain higher-than-average growth and expansion.
Larger, established companies tend to issue regular dividends as they seek to maximize shareholder wealth in ways aside from super-normal growth.
EPS (Rp)
The portion of a company’s profit allocated to each outstanding share of common stock.
Earnings per share serves as an indicator of a company’s profitability.
Calculated as:
Earnings Per Share (EPS) = ( Net Income – Dividends on Preferred Stock ) / Average Outstanding Shares
BV (Rp)
DEFINITION of Book Value:
1. The value at which an asset is carried on a balance sheet. To calculate, take the cost of an asset minus the accumulated depreciation.
2. The net asset value of a company, calculated by total assets minus intangible assets (patents, goodwill) and liabilities.
3. The initial outlay for an investment. This number may be net or gross of expenses such as trading costs, sales taxes, service charges and so on.
DAR (X)
A financial ratio that measures the extent of a company’s or consumer’s leverage.
The debt ratio is defined as the ratio of total long-term and short-term debt to total assets, expressed as a decimal or percentage.
It can be interpreted as the proportion of a company’s assets that are financed by debt.
Debt to Total Asset Ratio (DAR) = Total Debt / Total Assets
DER (X)
Debt/Equity Ratio is a debt ratio used to measure a company’s financial leverage, calculated by dividing a company’s total liabilities by its stockholders’ equity.
The D/E ratio indicates how much debt a company is using to finance its assets relative to the amount of value represented in shareholders’ equity.
The formula for calculating D/E ratios can be represented in the following way:
Debt – Equity Ratio = Total Liabilities / Shareholders’ Equity
ROA (%)
An indicator of how profitable a company is relative to its total assets.
ROA gives an idea as to how efficient management is at using its assets to generate earnings.
Calculated by dividing a company’s annual earnings by its total assets, ROA is displayed as a percentage.
Sometimes this is referred to as “return on investment”.
The formula for return on assets is:
Return On Assets (ROA) = Net Income / Total Assets
ROE (%)
This ratio indicates how profitable a company is by comparing its net income to its average shareholders’ equity.
The return on equity ratio (ROE) measures how much the shareholders earned for their investment in the company.
The higher the ratio percentage, the more efficient management is in utilizing its equity base and the better return is to investors.
Formula for return on equity is:
The return on equity ratio (ROE) = Net Income / Average Shareholders’ Equity
GPM (%)
DEFINITION of Gross Processing Margin (GPM):
The difference between the cost of a raw commodity and the income it generates once sold as a finished product.
Gross processing margins (GPM) are affected by supply and demand.
Because the prices for raw commodities and their processed versions fluctuate, investors are able to trade futures based on their expectations about changes in GPMs.
OPM (%)
DEFINITION of Operating Margin (OPM):
Operating margin is a margin ratio used to measure a company’s pricing strategy and operating efficiency.
Operating margin is a measurement of what proportion of a company’s revenue is left over after paying for variable costs of production such as wages, raw materials, etc.
It can be calculated by dividing a company’s operating income (also known as “operating profit”) during a given period by its net sales during the same period.
“Operating income” here refers to the profit that a company retains after removing operating expenses (such as cost of goods sold and wages) and depreciation.
“Net sales” here refers to the total value of sales minus the value of returned goods, allowances for damaged and missing goods, and discount sales.
Operating margin is expressed as a percentage, and the formula for calculating operating margin can be represented in the following way:
Operating Margin = Operating Income / Net Sales
NPM (%)
Net Profit Margin (NPM) is the ratio of net profits to revenues for a company or business segment, typically expressed as a percentage, that shows how much of each dollar earned by the company is translated into profits.
Net margins can generally be calculated as:
Net Margins = Net Profit / Revenue
Where Net Profit = Revenue – COGS – Operating Expenses – Interest and Taxes
Payout Ratio (%)
Payout ratio is the proportion of earnings paid out as dividends to shareholders, typically expressed as a percentage.
The payout ratio can also be expressed as dividends paid out as a proportion of cash flow.
The payout ratio is a key financial metric used to determine the sustainability of a company’s dividend payments.
A lower payout ratio is generally preferable to a higher payout ratio, with a ratio greater than 100% indicating the company is paying out more in dividends than it makes in net income.
The Payout Ratio is calculated as follows:
Payout Ratio = Dividends per Share (DPS) / Earnings per Share (EPS)
Yield (%)
A financial ratio that indicates how much a company pays out in dividends each year relative to its share price.
Dividend yield is represented as a percentage and can be calculated by dividing the dollar value of dividends paid in a given year per share of stock held by the dollar value of one share of stock.
The formula for calculating dividend yield may be represented as follows:
Dividend Yield = Annual Devidends per Share / Price per Share
Yields for a current year are often estimated using the previous year’s dividend yield or by taking the latest quarterly yield, multiplying by 4 (adjusting for seasonality) and dividing by the current share price.
Sources:
Investopedia: http://www.investopedia.com/